Macro Mod Analytics · Europe + USA · edition 1
Connecting data.
Creating insight.
One macro suite from the Eurostat catalogue to Semafor, MADS scenarios and a publication-ready report — 34+1 countries, six languages of control.
Home · M1–M6
HR + EN manuals and reports
HR · EN · FR · ES · IT · DE
O = slide map
02 · Agenda
What we will show — click to jump
01 · Why MMA
Why this is not another dashboard. Versus EC, OECD and Bloomberg.
02 · Who and where
34+1 countries, 6 UI languages, reports and manuals in HR and EN.
03 · Pipeline
Home → M1 optimizer → M2 tables, chart types, EU map and statistics.
04 · M3 and M4
A ready-made indicator set and premium diagnostics, plus live sunbursts.
05 · M6 · MADS
DSGE-lite model, scenarios, Δ vs baseline, model limits.
06 · Publications
Comprehensive, sector, MADS, policy brief + deck.
07 · 90 s demo D
Country X from input data to non-binding recommendations.
08 · Audiences
Students, research, media, government, think-tank.
09 · Position
SWOT and USP — why a portal cannot replace it.
10 · How to start
First 30 minutes. Manual HR/EN. START_SUITE.
Arrows / space = slide. O = map of all slides. F = fullscreen. D = start the 90-second demo.
03 · Hook
Macro data exist. The working flow usually does not.
Classic portal
Eurostat, ECB, OECD, AMECO: excellent sources — but they remain a catalogue, a table or a static dashboard. The analyst still glues Excel together.
Terminal / news flow
Bloomberg and similar tools give market speed. They rarely give a MIP↔macro bridge, Semafor and a reproducible comprehensive report for country X.
MMA
Pipeline: optimise the cube → build the table and chart → read the ready-made indicator set → diagnose the regime → scenario → report / policy brief.
Not another dashboard. It is a working language of macro analysis.
04 · Numbers that stick
The suite in one breath
34+1Europe + USA
6UI languages
8M3 sectors
9M4 blocks
39MADS scenarios
4+report types
HR + EN reports and manuals
Manuals and reports in the author’s home language and in universal EN — the same content, two readers.
Offline-first
M3/M4/publications run from a local RDS/CSV. The live API is a refresh, not a condition for the briefing.
Model honesty
Semafor ≠ Commission MIP assessment. MADS ≠ official forecast. Relative ≠ absolute.
05 · Why this is not “another dashboard”
What MMA does differently
| EC / Eurostat / OECD | Bloomberg-class | MMA Suite |
|---|
| Purpose | Publication and series browse | Market and news terminal | Analytical chain through to narrative |
| Filter before load | Often the whole cube | Ticker / function | Memory Optimizer (M1) |
| Stock–flow viz | Limited | Ad-hoc | Sankey in viz + MIP↔MMA map |
| Policy signal | MIP scoreboard (institution) | Not a MIP bridge | Semafor — a reading map, not a Commission assessment |
| Scenario | None in the portal | Other products | M6 MADS DSGE-lite (recommended + free) |
| Output | Download | Screen / alert | Comprehensive, sector, MADS, policy brief |
| UI languages | EN-dominant | EN | 6 languages of the control layer |
| Chart recommendation | A catalogue of types | Ad-hoc | Rank + %; Load Data draws mini-models |
06 · Coverage
34+1 countries · Europe and a USA reference

The same working language
EU27, EFTA, part of the Western Balkans and Turkey — plus the USA as a reference economy (FRED/WB routing). HICP is not converted 1:1 into CPI.
EU27NO · CH · IS
ME · MK · RSTRUSA
Peer groups, not only one country
HR, DE, V4, CEI, EA, EU27=100. Compare 2–8 countries in M4. The relative layer prevents a false comparison of development levels.
USA as a reference, not a copy of Europe
FRED/WB routing for US series. HICP is not converted 1:1 into CPI — the same working language, different sources, no fake 1:1.
07 · Languages
Six languages of control · reports and manuals in two languages
HRHrvatski
ENEnglish
FRFrançais
ESEspañol
ITItaliano
DEDeutsch
Control layer = 6 languages
The same navigation, localised buttons, help radio and SUITE bar. A correspondent in Madrid and a student in Zagreb see the same suite in their interface language.
Reports and manuals = HR + EN
User manuals and reports in the author’s home language (HR) and in EN as the universally recognised language of institutions, reviewers and media.
08 · Two tracks
Free exploration and a ready-made macro overview — side by side
Track A — free exploration
- M1: catalogue, geo/time filter, Load Optimized
- M2 Fetcher + Pivot → Final Tables
- Viz: Basic, Map, Sankey/Treemap, Stats
- For a seminar, a paper, an ad-hoc brief
Track B — ready-made macro overview
- M3: 8 sectors + relative EU27=100
- M4: 9 analytical blocks, Semafor, Compare
- M6 MADS: scenarios after the alarm
- M5: LATEST HTML/PDF catalogue
Homeorientation
M1optimizer
M2table + chart
M3scoreboard
M4diagnosis
M6MADS scenario
M5publication
Briefdeck
M1 does not automatically feed M4. By design: the reproducible report engine does not depend on the Explorer session cache.
09 · Home · suite landing
Command centre, not analysis
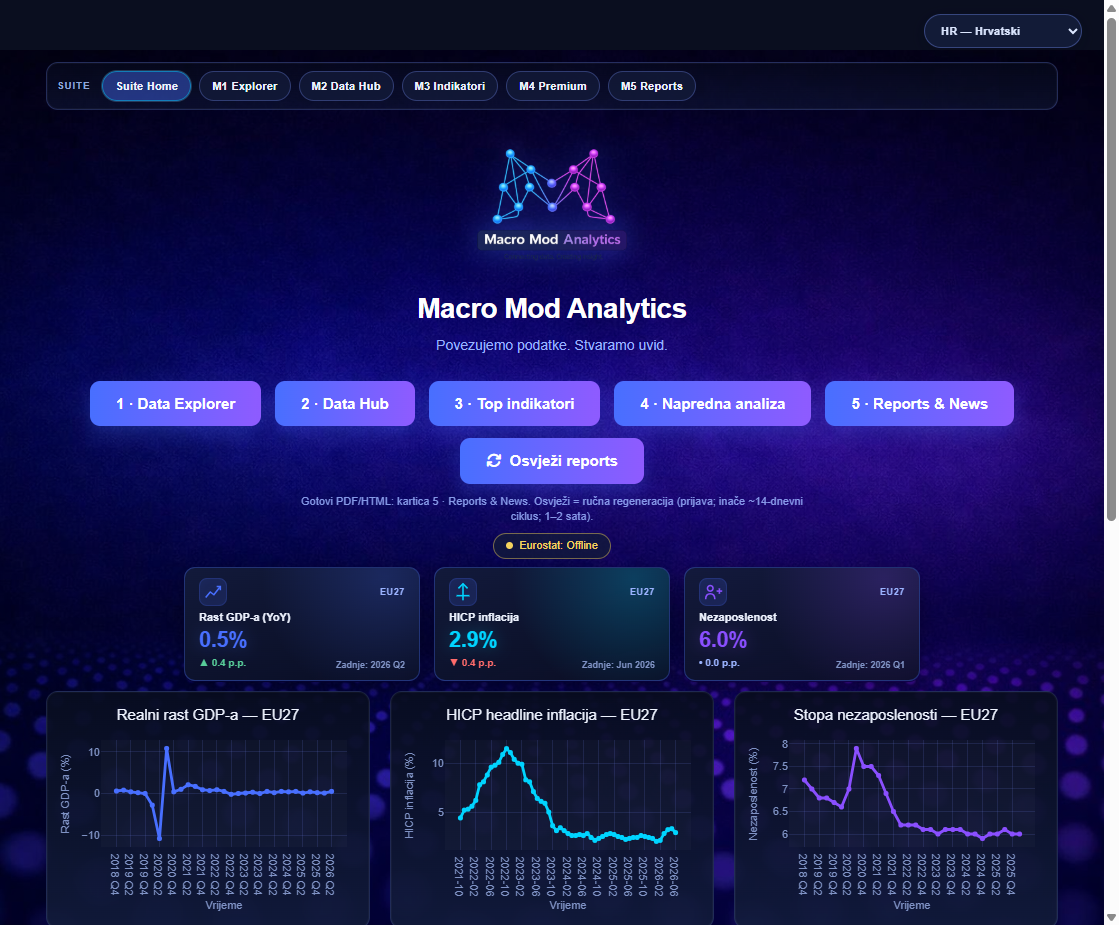
What you see in 10 seconds
- SUITE bar — the same 7 buttons (Home + M1–M6) in every module
- CTA M1–M6 and Refresh reports
- EU27 KPIs: GDP, HICP inflation, unemployment
- Source status (Eurostat: Offline / Live)
Intent
Orientation, language, Europe’s pulse. Depth lives in the modules. Report-refresh operator is not for the end user.
10 · M1 Data Explorer · landing
Optimising the cube before load
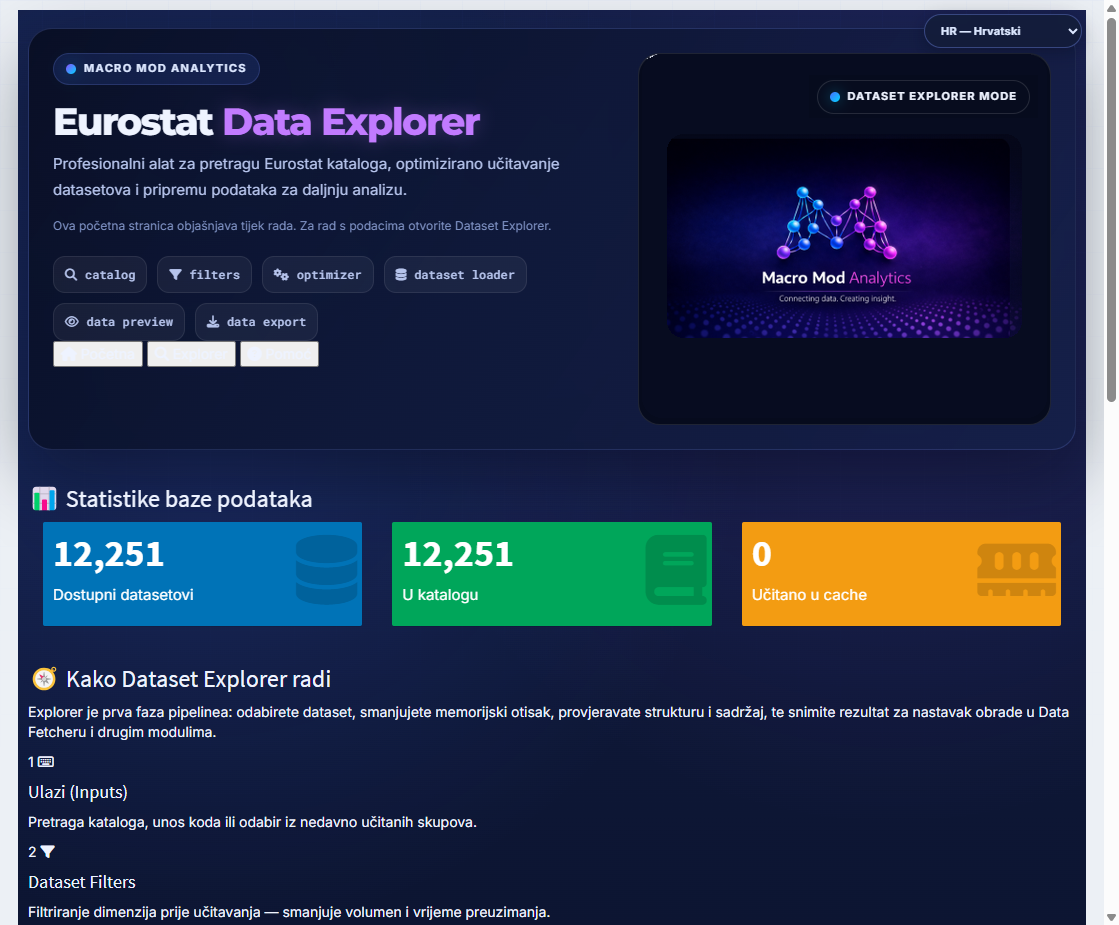
Why this is distinctive
A classic Eurostat download pulls too large a cube. M1 forces the filter before the API/cache load — geo, time, frequency.
- Catalogue: ~12,251 available datasets
- Catalog · Filters · Optimizer · Dataset loader
- Data preview → Data export
- Save for Analysis → M2 cache
That is the difference between “I have a CSV” and “I have a controlled sample for analysis”.
11 · M2 Data Hub · landing
Tables you can defend
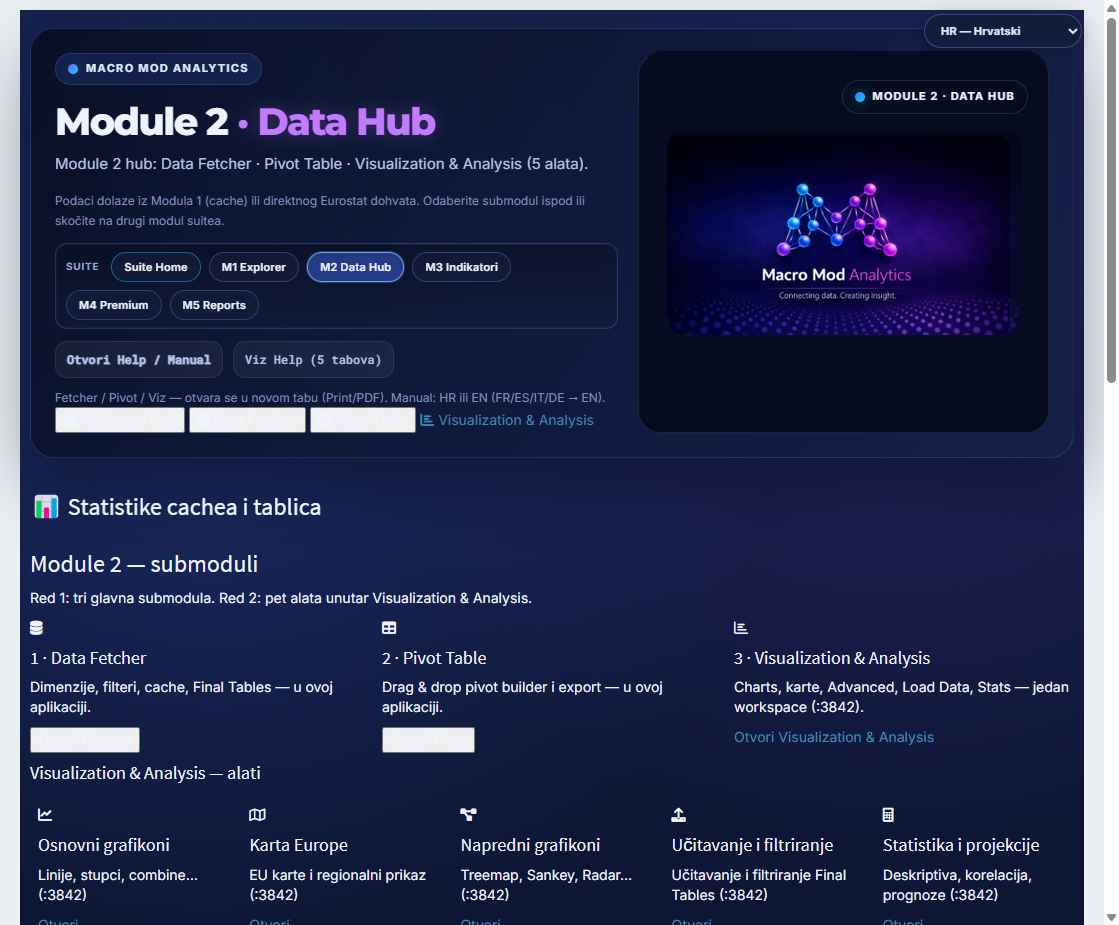
Three doors of the hub
- Data Fetcher — dimensions, filters, cache, Final Tables
- Pivot Table — drag & drop builder and export
- Visualization & Analysis — 5 tools in one workspace
Where the data come from
From Module 1 (cache) or directly from Eurostat. Help / Manual opens the HR or EN handbook; FR/ES/IT/DE fall back to EN.
12 · Charts for macro · Visualization & Analysis
From a line to a stock–flow Sankey
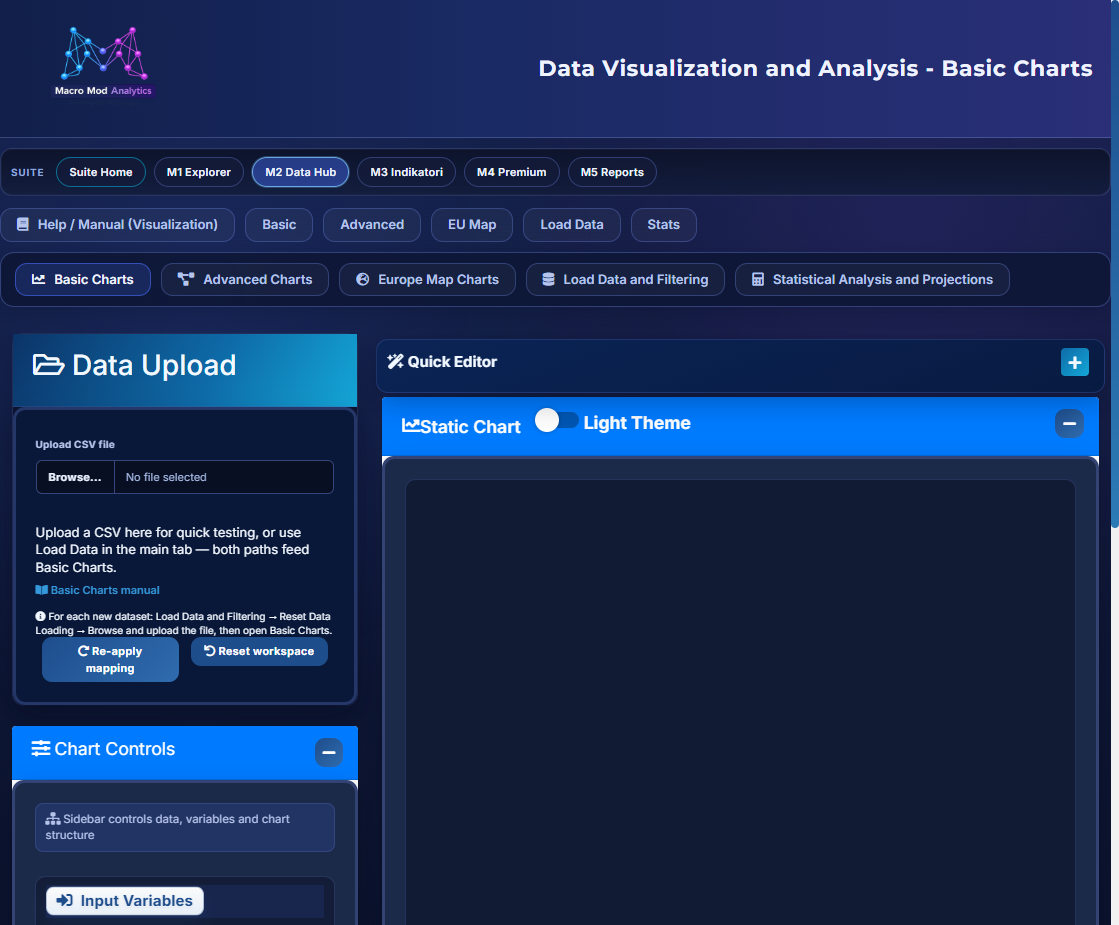
Five tools in one workspace
Basic Charts — 10 types (line, bar, stacked, combined, area, scatter, box, histogram, pie/donut/sunburst, step) · Advanced Charts — 8 types (decomposition, Treemap, Sankey, Chord, Variwide, Radar, Dumbbell, Lorenz) · Europe Map Charts · Load Data & Filtering · Statistical Analysis and Projections.
Why Sankey
Macro is a flow: income → consumption / saving / investment; CA = NX + incomes; MIP column → MMA alarm. Sankey is the natural language of a stock-and-flow story — that is why it sits in Advanced and in the M5 system map.
The next four slides
Concrete examples: the basic set (COICOP, dual axis, stacked GDP, histogram, sunburst), the advanced set (Variwide, decomposition, Chord, time heatmap) and the EU map plus statistical tools.
13 · Charts · basic set
The types macro actually asks for
Bars with COICOP categories — household consumption structure
Combined chart, dual axis — price index (left) and inflation rate (right)
Stacked bar — component contributions to the GDP growth rate
Histogram — firms by average-wage class
Pie / sunburst, two levels — the balance of payments and its accounts
Why these types
- Dual axis — the level and the rate are not the same order of magnitude; without a right axis inflation vanishes into the index
- Stacked — growth is not a number, it is a sum of contributions; you see at once whether consumption or net exports carry it
- Histogram — the average wage can lie; the distribution shows where the mass sits
- Two-level pie/sunburst — the aggregate and its accounts in one frame, click to go deeper
Charts on this slide are live Plotly examples with illustrative values — in the app you build them from your Final Table.
14 · Charts · advanced set
Advanced types — for processes, not for pictures
Variwide — height = level, width = country weight
Line decomposition — trend and seasonally adjusted series
Chord — mutual flows between sectors
Time heatmap — inflation by month and year (illustrative)
Variwide
A ranking without the cheat: Luxembourg and Germany are not the same “one bar”. Width carries population or GDP, height the per-capita indicator.
Decomposition
STL or classical, additive or multiplicative, frequency 4 / 12 / 52. Separates season from signal before a conclusion about trend.
Chord and Sankey
Sankey for directed flow, Chord for mutual relations (trade, exposures). Both are in Advanced Charts and in the manual.
Time heatmap + the rest
Year × month reveals a seasonal rhythm a line conceals. Plus: Treemap, Radar, Dumbbell, Lorenz. The heatmap here is illustrative only — it is not a catalogue type in Advanced.
15 · EU map and statistical tools
Europe’s map and statistics in the same workspace
Europe Map Charts
Choropleth for EU27 and beyond, Animate Over Time for movement across years, inset maps for small jurisdictions, Zoom to EU27, plus an automatic statistics panel and extremes (top 3 highest / lowest).
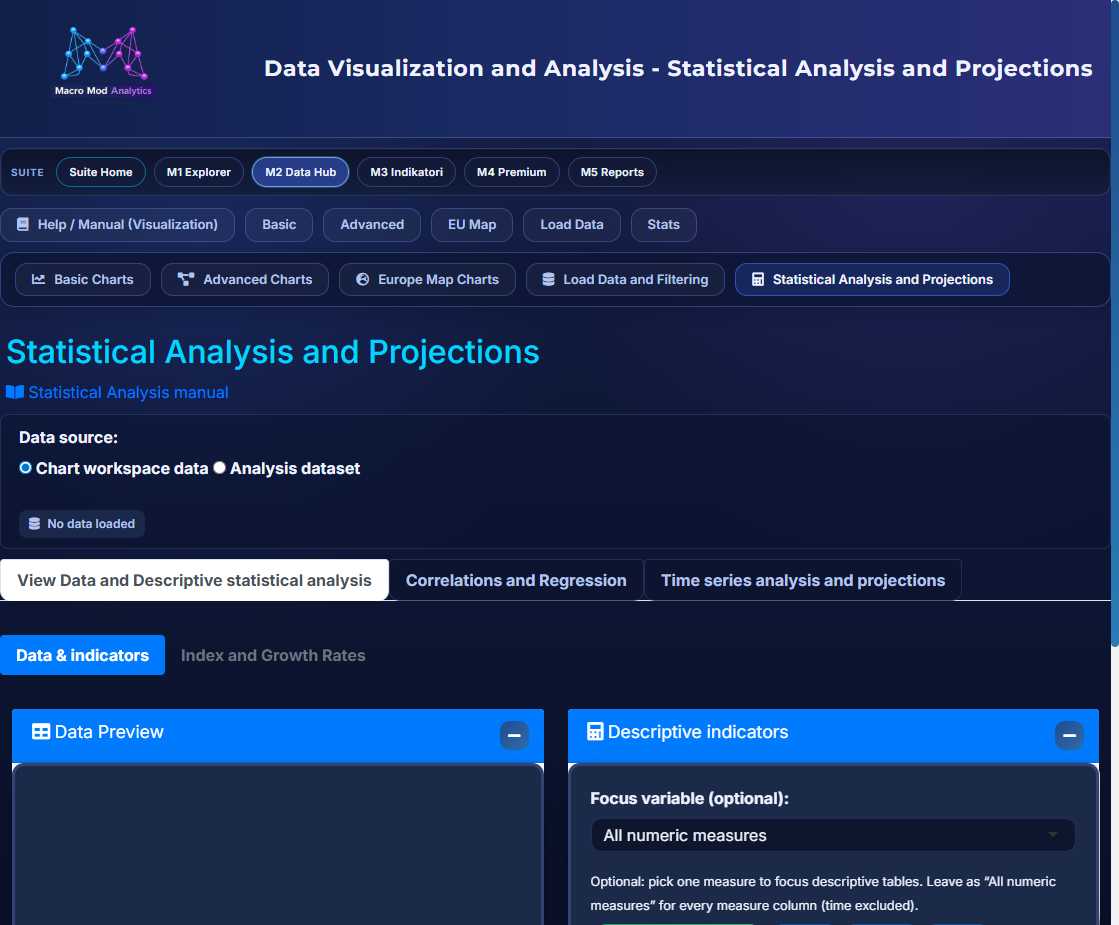
Statistical Analysis and Projections
Three blocks: descriptive (Data & indicators, Index and Growth Rates — YoY / QoQ / MoM), correlations and regression (Pearson, Spearman, Kendall; linear, exponential and polynomial fit), time-series analysis (STL and classical decomposition, ACF / PACF, ARIMA, ETS, Holt-Winters, linear trend, seasonal naive — with a confidence interval).
The same data layer: what you loaded in Load Data & Filtering is immediately available to charts, the map and statistics.
16 · Innovation · smart chart recommendation
The engine ranks the chart type against your table
Load Data & Filtering
After you pick a file, the Chart Examples toggle draws mini-models (small Plotly charts) for recommended types — a % score, TOP PICK, Use chart / Apply Top Pick.
Basic Charts
The same ranking engine: cards with rank, probability 0–100, a reason and an AI insight. No mini chart-models — here it is rank, not preview.
Advanced Charts
The same mechanism for Treemap, Sankey, Chord, decomposition… Apply Top Pick applies the type and mapping. Mini drawings stay on Load Data only.
Why this is uncommon
Portals (Eurostat, OECD) and terminals offer a catalogue of types. MMA inspects the shape of your Final Table (time, geo, categories, numeric columns) and scores fitness. The analyst still decides — the engine only proposes. Rare in similar macro systems: a drawn preview on load, then rank-without-drawing in Basic and Advanced.
Not an automatic report drawer: TOP PICK is a proposal, not an obligation.
17 · Live Sankey — pipeline
How value flows through the suite
Interactive: hover the flows. A pedagogical map of the suite, not a MIP assessment.
18 · M3 Top Indicators · landing
Eight sectors + relative EU27=100
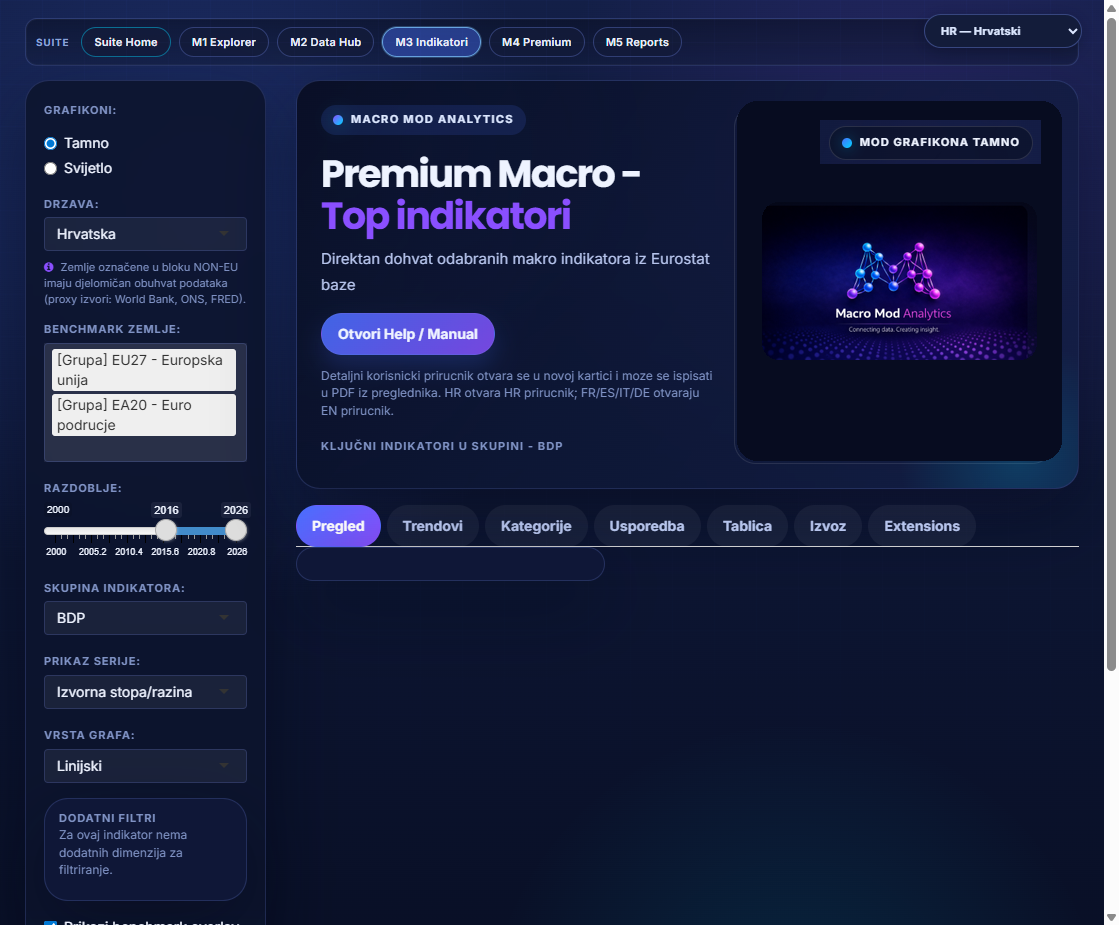
What the user chooses
- Country and benchmark groups (EU27, EA20, V4…)
- Period, indicator group, series display, chart type
- Overview · Trends · Categories · Comparison · Table · Export
- Relative indicators: 100 = Union average
- NON-EU countries: proxy sources (World Bank, ONS, FRED)
M3 does not give a composite alarm. When you need “is it red?”, you go to M4.
19 · Interactive · M3 sunburst
Click a sector — the indicators open
First level = 8 M3 macro groups (selection subtabs). Second level = series. Click to zoom in, click the centre to return.
20 · M4 Premium Macro · landing
Diagnosis, not another scoreboard
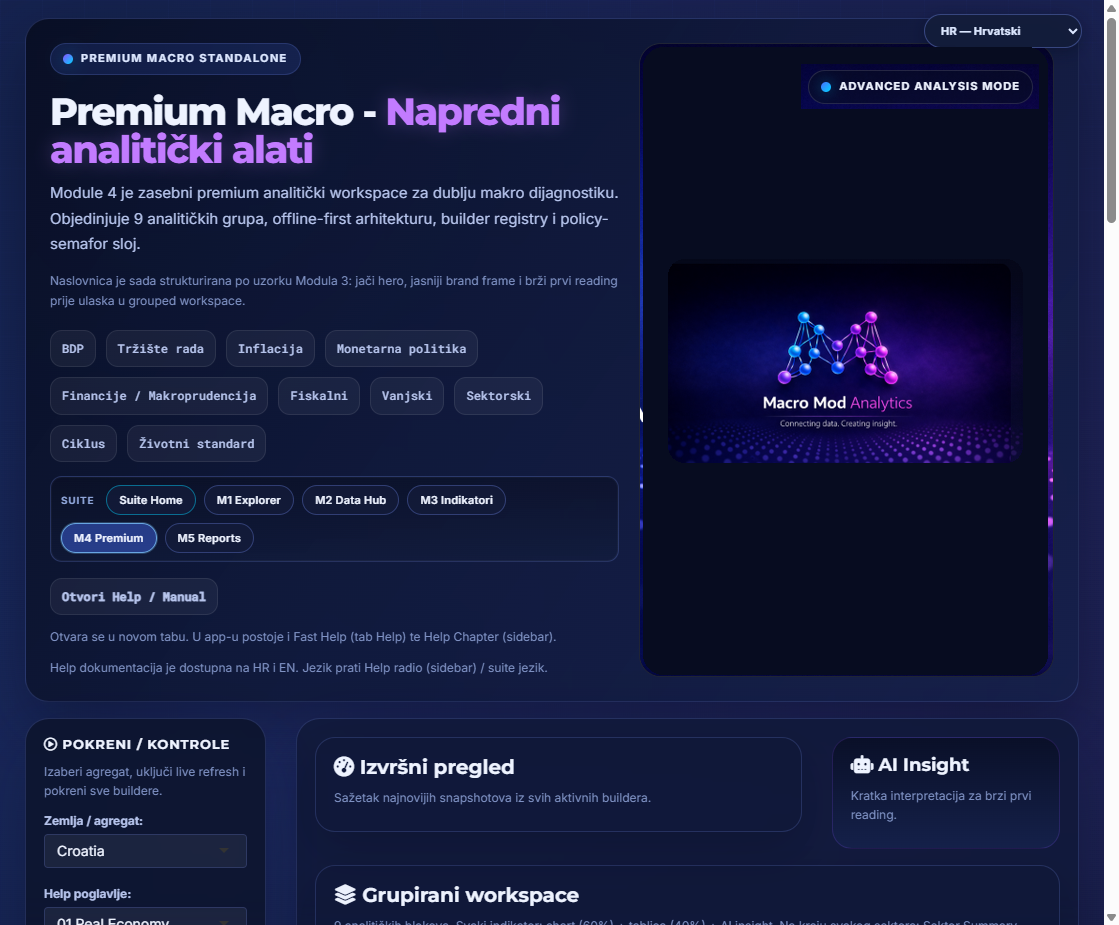
Read-first rule
- Country / aggregate → Run builders
- Executive overview + AI Insight for the first reading
- Grouped workspace: 9 blocks, each chart 60% + table 40%
- Semafor: 3 policy signals + 4 qualifiers
- Compare 2–8 countries (EU27=100) → comprehensive / sector PDF
Semafor is a reading map, not an automatic decision and not a Commission MIP assessment.
21 · Interactive · M4 sunburst
Chapters and tools (workspace subtabs)
First level = analytical blocks. Second = tools the analyst opens as tabs after Run.
22 · Semafor
Red is not a verdict. It is a reading priority.
Red
Tension that deserves an owning chapter: fiscal NGT gap, monetary mismatch, macro-risk board, nowcast pulse. Go there first.
Yellow
Qualifiers: inflation (persistence), labour market, FCI / credit-housing cycle. Rule: do not push yellow into red while you are correcting red.
Green
Not “everything is fine forever”. It is the absence of an alarm in that column — you still read relative M3.
For a cabinet and a newsroom: “MMA signals tension in …; the detail is in chapter …” — never “the Commission said”.
Semafor is the door into M6: the red column decides which MADS packages are even worth simulating.
23 · M6 · MADS · landing
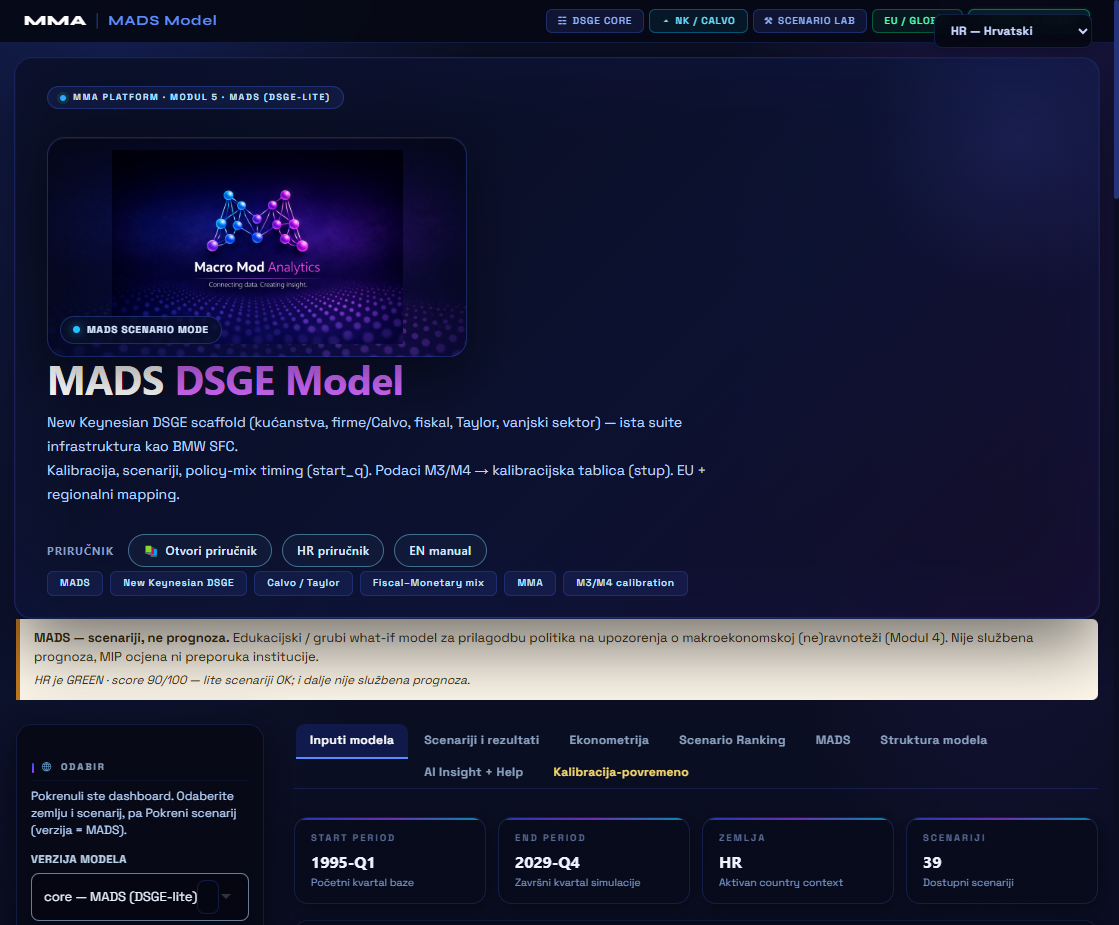
MADS DSGE Model — scenarios, not a forecast
What MADS is
A New Keynesian DSGE scaffold (households, firms / Calvo, fiscal, Taylor, external sector) — a DSGE-lite model inside the same suite, calibrated from M3/M4 data.
When you come here
Only after M4 Semafor has set an alarm. MADS answers “what if we pull this lever” — not “what will GDP be in 2028.”
1995-Q1sample start
2029-Q4simulation end
39scenarios
HR · EU+ regional mapping
24 · M6 · model structure
Five blocks and calibration from the suite
Households
Consumption, saving, labour — Euler and labour supply.
Firms / Calvo
Sticky prices, mark-ups, cost pass-through into inflation.
Fiscal
Expenditure, taxes, debt and debt dynamics (NGT layer).
Monetary / Taylor
Interest-rate reaction to inflation and the output gap.
External sector
Exports/imports, competitiveness, CA and NIIP.
Calibration, not invention
M3/M4 data enter the calibration table (pillar). Scenarios and policy-mix timing are tied to the start quarter (start_q), so a shock can be dated, not merely “switched on”.
Workflow tabs
Model inputs · Scenarios and results · Econometrics · Scenario Ranking · Model structure · AI Insight + Help · Calibration. Manual: HR and EN.
25 · M6 · interactive · scenarios
Click a shock family — the instruments open
Two kinds: M4-recommended packages (tied to the red Semafor column, MIP and MMA variant) and free / custom what-ifs in the parameter editor.
26 · M6 · result
Δ vs Baseline — Croatia example
Positive
Competitiveness +0.79% GDP; external rebalancing +0.42–0.44%.
Almost neutral
Monetary normalisation +0.11% GDP, but +0.68 p.p. on rates.
Short-run cost
Fiscal debt adjustment −1.69%; composition −0.88%.
Trade-off
Credit de-leveraging: debt −9.47%, but GDP −0.36%.
Source: MADS policy brief for HR (Δ vs baseline by package). Success is not maximising GDP, it is relieving red while protecting yellow.
27 · M6 · limits
What MADS is not — and why that builds trust
Not an official forecast
The banner sits in the UI itself: educational / rough what-if model. No institutional projection, no obligation.
Not a MIP assessment
MIP and MMA package variants exist in parallel, but the imbalance assessment is the Commission’s, not MADS.
Not an institutional recommendation
The result is a Δ path under assumptions the user sees and can change — with AI Insight as a reading aid.
Output from M6
Δ vs Baseline for Y, u, π, CA, debt and NIIP · Scenario Ranking · short MADS report · policy brief M3→M6 · PPTX brief deck.
Why this is an advantage
A serious user does not want a tool that claims too much. They want a tool that says exactly how far it holds — and can then be cited.
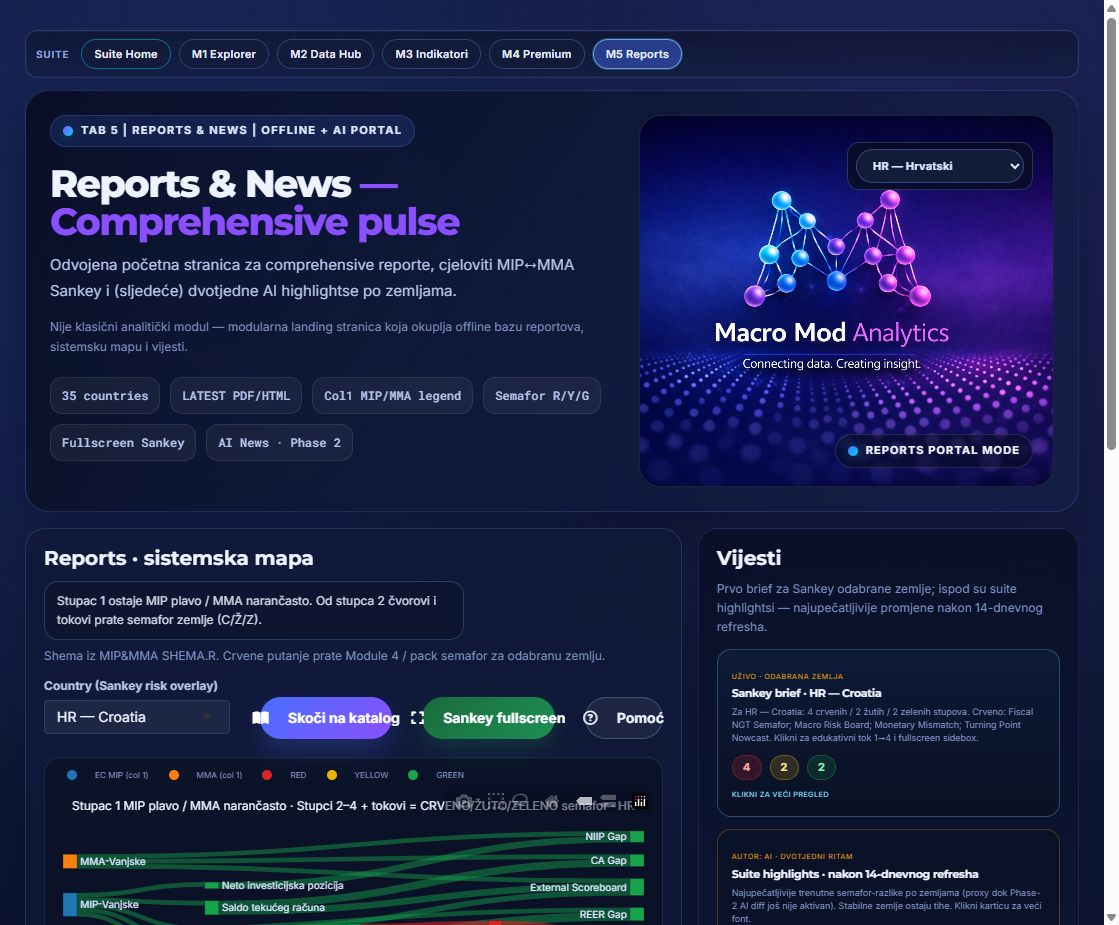
28 · Publications · M5 Reports & News
From analysis to an artefact you can send
01
Comprehensive
Gold-standard PDF/HTML for 34 countries: TOC, M3 wide, Semafor, deep chapters.
02
Sector
Shorter pack: inflation/monetary, labour, fiscal, GDP, external, financial.
03
MADS report
Scenario vs baseline: instruments, horizon, Δ paths.
04
Policy brief M3→M6
One thesis, Semafor, recommended packages + PPTX brief deck.
Plus: MIP↔MMA system map (column 1 blue/orange), Sankey fullscreen by country and AI news on a fortnightly beat.
29 · Demo · 90 seconds
Country X in 90 seconds — from data to a recommendation
Six steps of 15 seconds. The same path an analyst actually walks: input data → ready-made indicators → premium tools → Semafor → scenario test → non-binding recommendations. Example: Croatia, policy brief M3→M6.
0:00–0:151 · Input dataEurostat/ECB cube, filter before load, offline snapshot.
0:15–0:302 · Top indicatorsM3: where the country stands and what misses the target.
0:30–0:453 · Premium toolsM4: the mechanism behind the signal, owning chapter.
0:45–1:004 · SemaforIdentification: what is red, what is protected.
1:00–1:155 · Scenario testM6 MADS: a response to red, Δ vs baseline.
1:15–1:306 · RecommendationsNon-binding brief + deck for stakeholders.
Modules the demo touches
M1 OptimizerM2 Data HubM3 Top IndicatorsM4 PremiumM6 MADSM5 Reports
What the viewer gets
One diagnosis, one tested response and one document — no manual stitching of sources, no Excel between steps.
What the demo does not promise
Not a forecast and not an institutional assessment. All numbers are an illustrative MADS output for HR, marked as working and non-binding.
Press D to auto-run the demo flow (15 s per step) or click any step.
0:00–0:15 STEP 1/6
30 · Demo · input data
First question: which sample are we even looking at?
What happens in 15 seconds
- Select country X and the period — filter before load
- Catalogue ~12,251 datasets; only the needed cube is taken
- For a standing review: the offline snapshot (RDS/CSV) is already ready
- Sources by series: Eurostat, ECB, and for NON-EU a proxy (WB, ONS, FRED)
Why this is not a formality
If the sample is uncontrolled, everything downstream is guessing. This is where you decide whether the later Semafor is even comparable with Europe.
0:15–0:30 STEP 2/6
31 · Demo · M3 Top Indicators
Where country X misses the target
GDP YoY 2.4%
Target > 2.5% — a slowdown, below the reference dynamic.
HICP 3.6%
Target < 2.5% — persistent inflationary pressure.
Unemployment 5.1%
Target < 4.5% — a mild rise versus the previous quarter.
Nowcast pulse −0.37
Target > 0 — a contraction signal for activity.
M3 shows the state and the gap from target. It does not yet say why — and deliberately does not give a composite alarm.
0:30–0:45 STEP 3/6
32 · Demo · M4 premium tools
Why this is happening — the mechanism, not a slogan
Three chapters that open for this case
- Fiscal → NGT & vulnerability, debt dynamics, CAB/CAPB: gap 2.54 p.p.
- Monetary → Taylor / NGT and transmission: mismatch −4.16 p.p.
- Credit / FCI → housing cycle and credit gap: FCI 0.31, housing segment mixed
Plus the short cycle
Macro pulse and nowcast/surprise confirm the direction (−0.37), and Compare places country X next to its peer group on EU27=100.
Each indicator = chart + table + AI insight
At the end of the block, a Sector Summary — text you can quote in the brief.
0:45–1:00 STEP 4/6
33 · Demo · Semafor identification
Semafor for country X: three red, three yellow
Fiscal NGT2.54 p.p.gap vs target < 1.5
Monetary−4.16 p.p.mismatch vs target > −2
Macro risk boardHeat / Distgreen / yellow mix
Inflation3.6%persistence
Labour market5.1%cost pass-through
FCI / credit0.31housing cycle
External balancepositivecompetitiveness trend
Red → which scenario
The fiscal gap opens MIP debt adjustment and MMA expenditure composition. The monetary mismatch opens normalisation and a Taylor tilt.
Yellow → what is protected
Inflation, the labour market and FCI are constraints, not the target of the measure. Every tested package is also checked on their direction.
Green → what you build on
A positive competitiveness trend becomes the counterweight to the short-run cost of consolidation.
Reading rule: red is solved first, but yellow must not be pushed into red in the process. Semafor is a priority map — not a European Commission MIP assessment, and not an automatic decision.
This is the point where a classic dashboard stops. MMA goes on: the red columns decide which scenarios are worth testing.
1:00–1:15 STEP 5/6
34 · Demo · answering Semafor through scenarios
M6 MADS: we test a response, we do not guess the future
What is tested for the red fiscal column
Two packages from the M4 recommendation — the MIP variant (debt adjustment) and the MMA variant (expenditure composition). Same model, same horizon, different dose.
What the test shows
- Sharper variant: ΔGDP −1.69%, ΔG −5.97%, ΔL −0.77%
- Softer composition: ΔGDP −0.88%, ΔG −2.59%, ΔL −0.42%
- Competitiveness as counterweight: ΔGDP +0.79%
- Monetary normalisation: ΔGDP +0.11%, rates +0.68 p.p.
Test conclusion
Consolidation is necessary, but it must be phased and combined with a package that contributes positively to growth — otherwise red eases and yellow turns red.
1:15–1:30 STEP 6/6
35 · Demo · non-binding recommendations for country X
Output: four messages you can send
01Prioritise competitiveness
The only package with a clearly positive effect (+0.79% GDP) — structural reforms, productivity, export quality.
02Phase fiscal consolidation
Necessary for sustainability, but spread over time and protect investment so the slowdown is not deepened.
03Protect financial conditions
Do not loosen FCI too fast; macroprudential monitoring of the housing segment and the credit cycle.
04Watch inflation expectations
Alignment of wages and productivity; avoid measures that further strengthen aggregate demand.
Artefacts from the same flow
Comprehensive/sector report, MADS report, policy brief M3→M6 and PPTX brief deck — HR and EN.
Document status
“Working, non-binding summary (MADS)”. That is how it stands in the generated brief — no pretence that it is an official forecast.
Measure of success
Not maximising GDP, but the direction of relieving red while protecting yellow.
90 seconds later: country X has a diagnosis, a tested response and a document for the meeting — with the model’s limits clearly marked.
36 · Audience · students
From catalogue to a seminar chart in 10 minutes

- Sees the whole pipeline — not “download a CSV from the web”
- Filters teach Eurostat dimensions (geo, time, unit)
- Sankey and the map for a macro story, not only a line
- MADS shows DSGE-style scenario logic without MATLAB / Dynare
- Manual HR/EN; UI in the language of the course
- Mandatory attribution: source Eurostat/ECB, processing MMA
MMA is not a textbook. It is a laboratory in which you see how a series becomes an argument.
37 · Audience · research
Reproducibility and peer context

Code and cache
Dataset code, filters, Final Table name, offline snapshot — the work can be repeated a week later.
EU27=100
The relative layer prevents a false comparison of absolute rates across different development levels.
Model limits
ARIMA/ETS and MADS are explicitly not an official forecast. A paper cites the tool as diagnostics.
Scenario analysis
MADS calibration and Scenario Ranking give a transparent frame for the robustness of the story.
38 · Audience · media
Newsroom speed, source discipline

- M5 catalogue: LATEST HTML/PDF for the country in the news
- Sankey brief by country + suite highlights after a refresh
- One sentence for the headline, owning chapter for “why”
- MADS packages give a measurable frame for “what if”
- UI language: HR for a Croatian newsroom, EN/DE/FR/IT/ES for correspondents
A specialised economics desk gets a pack with a disclaimer, not a screenshot without context.
39 · Audience · government
15 minutes to a message — without false authority

Flow for a cabinet / ministry / central bank
- Home KPI (Europe’s direction) → M5 PDF of country X
- Semafor: where the tension is (fiscal, monetary mismatch, risk board)
- M4 chapter: the mechanism, not a slogan
- M6 MADS: packages tied to red + free what-if
- Policy brief M3→M6 + deck for the meeting
The same flow for 34+1 jurisdictions — a comparable language across ministries and central banks.
40 · Other users
Who else benefits
Think-tank / NGO
Compare radar + relative indicators for a peer narrative (V4, CEI, EA).
Consultants
The same pack for 34 countries: fast screening then a deep chapter only where hours are needed.
IFI / donors
USA + EU + candidates in one working language; explicit sources by series.
Operators
START_SUITE, weekly/fortnightly production release, gold QA, LATEST catalogue.
41 · SWOT
MMA’s position among tools
Strengths
The whole chain through to publication, including its own scenario model and smart chart recommendation. 6 UI languages. Reports and manuals in HR and EN. Offline-first. Honest disclaimer. Sankey and Semafor as its own language.
Weaknesses (by design)
Not a tick-by-tick terminal. Not the Commission’s official database. MADS is DSGE-lite, not institutional MADS. That is a conscious limit, not a bug.
Opportunities
Faculties, newsrooms, cabinets and think-tanks in 34+1 countries that need the same briefing language — without pretending to be Bloomberg or Eurostat.
Threats / substitution
A portal + Excel is still “enough” if the user does not see the value of the narrative. That is why the brief and the deck exist: so the end of the chain is visible.
42 · USP
Why MMA is hard to replace with a portal

One language
From cube filters to Semafor and scenarios — the same countries, the same sources, the same disclaimer.
Diagnosis + artefact
A dashboard that does not produce a PDF/brief remains a screen. MMA finishes with a publication.
Scenario in-house
Few dashboards have their own DSGE-lite layer tied to an alarm from the same system.
Model honesty
Semafor ≠ MIP. MADS ≠ forecast. Relative ≠ absolute.
Smart chart recommendation
Rank 0–100 and TOP PICK from table shape; mini-models on Load Data, rank without drawings in Basic/Advanced.
43 · Documentation
A manual that follows the product
A single user handbook — HR then EN — with original Home and module covers, plus embedded M1–M4 and MADS manuals.
HR
MMA_SUITE_KORISNICKI_MANUAL.html — author’s language, operational detail.
EN
MMA_SUITE_USER_MANUAL_EN.html — for international users, reviewers, partners.
MADS manual
HR and EN version inside M6 — theory, calibration, scenarios.
In-app help
Help tabs and Rmd in the modules; the same theory as in M4 chapter Help.
44 · How to start
The first 30 minutes
1 START_SUITE.bat→
2 Home, language HR/EN→
3 M5 PDF of your country→
4 M3 relative→
5 M4 Semafor→
6 M6 MADS scenario
Ad-hoc path
M1 HICP or GDP → M2 pivot → Basic or Sankey → export PNG with the source.
Policy path
Do not start from Explorer. Start from the report and Semafor. Explorer is for the question the report did not cover.
Scenario path
Semafor → M6: first an M4-recommended package, then a free what-if, then a MADS report or policy brief.
For a fast view of the whole chain: D starts the 90-second demo flow (slides 29–35).
Call
See country X.
Not just a series.
Macro Mod Analytics — a suite for those who need insight, not another screen of charts. 34+1 countries. 6 languages of control. Home + M1–M6. Manuals and reports in HR and EN.
Connecting data. Creating insight.
Home :3837 · START_SUITE.bat